How to interpret the Report visualizations
Each Report is comprised of one or more widgets. Widgets are responsive, dynamic visualizations that contain granular information about the portfolio risk/return characteristics.
In order to familiarize yourself with each widget, please refer to a detailed description in the following link: Widget List
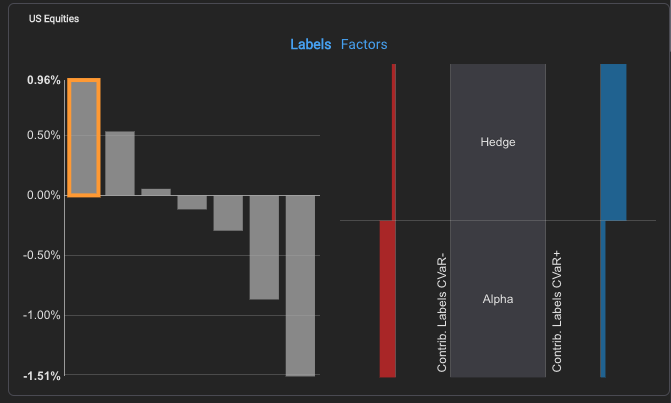
Example of a Widget for Stress Test