Private Investments
Everysk can seamlessly integrate illiquid investments with a portfolio of traded securities and funds. Illiquid investments such as venture capital, buyout, private credit and private real estate have no reliable time series (like AAPL stock for example). The secondary markets for these investments are very thin and the only observable data are the cashflows from limited partners.
The lack of data is problematic because illiquid investments are prominent in the portfolios of high net worth individuals.
Everysk uses state-of-the-art techniques to map an illiquid investment (buyout, VC, private real estate and private credit) from a specific vintage year to stable exposures using a fama and french 5-factor model.
Methodology
Imagine a matrix, whereby each column represents a different illiquid fund and each row represents monthly capital calls and distributions from the funds.
In order to calculate the internal rate of return for each fund, one would simply calculate the constant rate that discounts all cashflows from a single column to have a net present value of zero. Assuming the fund we are interested is in column 1 of the panel data:
where:
- \(\small \displaystyle t_{01}\) is the inception of the fund.
- \(\small \displaystyle L_{1}\) is the liquidation of the fund or a maximum horizon.
- \(\small \displaystyle D_{1t}\) is a distribution for fund 1 at time t
- \(\small \displaystyle C_{1t}\) is capital call for fund 1 at time t
IRR makes the simplistic assumption that cashflows can be reinvested at a constant rate, but we know that capital calls and distributions happening at different points in time are exposed to different market conditions. Thus, our methodology assumes a varying discount rate, whereby cashflows are discounted by a market model (in our implementation, the fama and french 5 factor model):
where:
- \(\small \displaystyle r_{f,s}\) is the risk-free rate on a cashflow date
- \(\small \displaystyle \Beta_{k}\) are the betas to fama french 5 factor model, described below.
- \(\small \displaystyle r_{k,s}\) are the factor returns on cashflow dates
- \(\small \displaystyle \alpha\) is the intercept of the factor model.
The 5 factor fama-french model measures persistent risk premia as follows:
| Factor | explanation |
|---|---|
| Mkt-RF | Excess return of market exposure |
| HML | Measures the value risk premia |
| SMB | Measures the size risk premia |
| RMW | Profitability risk premia |
| CMA | Measures aggressiveness premia (leverage) |
The single equation above (for one private fund) is insufficient to solve for the 6 unknowns: \(\small \alpha\) and the 5 \(\small \Beta_{k}\). The solution is found by looking for values for the unknowns that bring the net present values of ALL funds as close as possible to zero. The optimization is performed cross-sectionally using all funds, which makes the system overdetermined and a unique solution is found.
Solution
The overdetermined system of equations can be solved using a Generalized Method of moments approach with the following equation:
where:
We perform separate minimizations above for the 4 different types of fund classifications (buyout, VC, private credit and private real estate) and for a set of vintages. "N" in the minimization represents the number of funds within same type and vintage used.
The final outcome of these minimizations is a lookup table that maps the type of illiquid funds from a specific vintage to a custom index comprised of alpha plus a linear combination of fama french factors.
Examples
Private Real Estate
For example, AEW’s (www.aew.com) Fund VI is a private real estate fund from a 2010
vintage. It will be mapped internally to the following monthly factor exposures: a) HML (value
factor), SMB (size factor), RMW (profitability factor), CMA (investment factor) and Mkt-RF
(excess return of market) as follows:
| Mkt-RF | HML | SMB | RMW | CMA | Alpha (p.m.) | ||
|---|---|---|---|---|---|---|---|
| AEW VI | 0.93 | 1.45 | 0.27 | -0.78 | -0.79 | 0.38% |
- Betas to Fama French 5 factors plus Alpha -
Therefore, this private real estate fund will be modeled internally as a linear combination of risk premia according to the betas above. The factor exposures are intuitively correct: the negative exposures to CMA and RMW indicate a hight debt load involved in real estate projects, and a leveraged exposure to value (HML).
The 3 year total return index representative of AEW VI is plotted below in blue and contrasted with Russell 2000 total return in yellow:
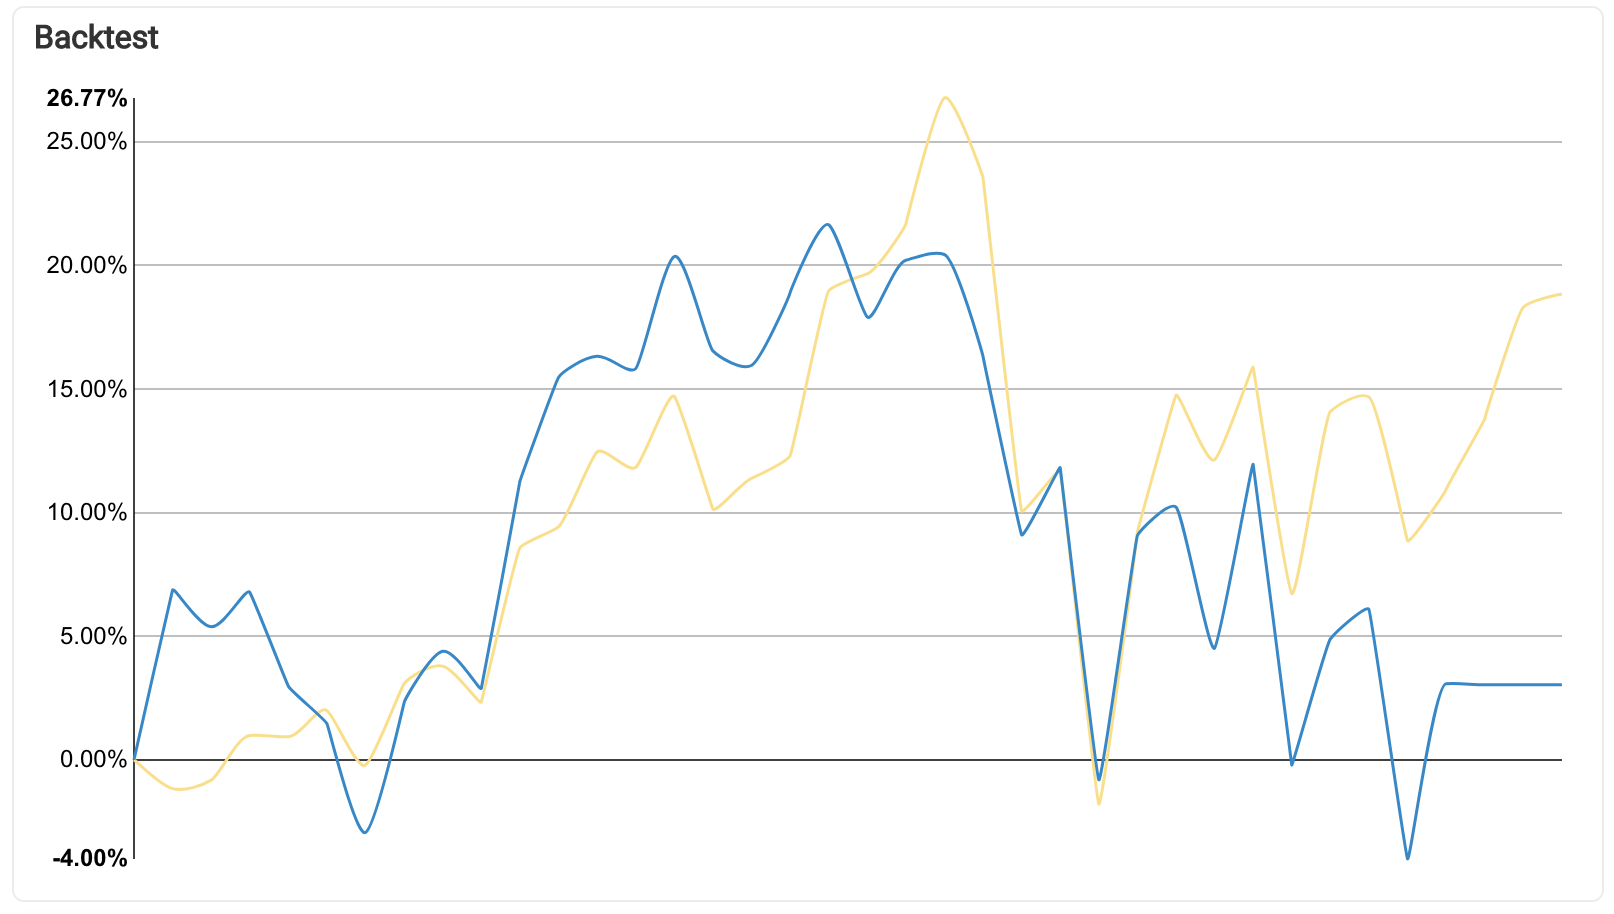
- Total Return for Private RE (blue) vs RUT (yellow) from Dec 2016 to Dec 2019 -
The main performance detractor for the private real estate index above was the leveraged exposure (1.45) to value factor (HML), which performed poorly in the last 3 years:
| Mkt-RF | HML | SMB | RMW | CMA | |
|---|---|---|---|---|---|
| Average monthly Return (%) | 0.96 | -0.91 | -0.44 | 0.28 | -0.36 |
- Average monthly return for Fama French 5 factors from Dec 2016 to Dec 2019 -
Venture Capital
As another example, let's look at Menlo Ventures XI, a venture fund also from 2010 vintage. This fund would be modeled internally as:
| Mkt-RF | HML | SMB | RMW | CMA | Alpha (p.m.) | ||
|---|---|---|---|---|---|---|---|
| Menlo XI | 0.61 | -0.48 | 0.0 | 1.30 | 0.0 | 0.34% |
- Betas to Fama French 5 factors plus Alpha -
The exposures to risk premia are very different from the private real estate fund with same vintage. Here we have positive loadings into robust profitability (a positive performer) and negative loading into value (a negative performer), providing a boost for the representative index:
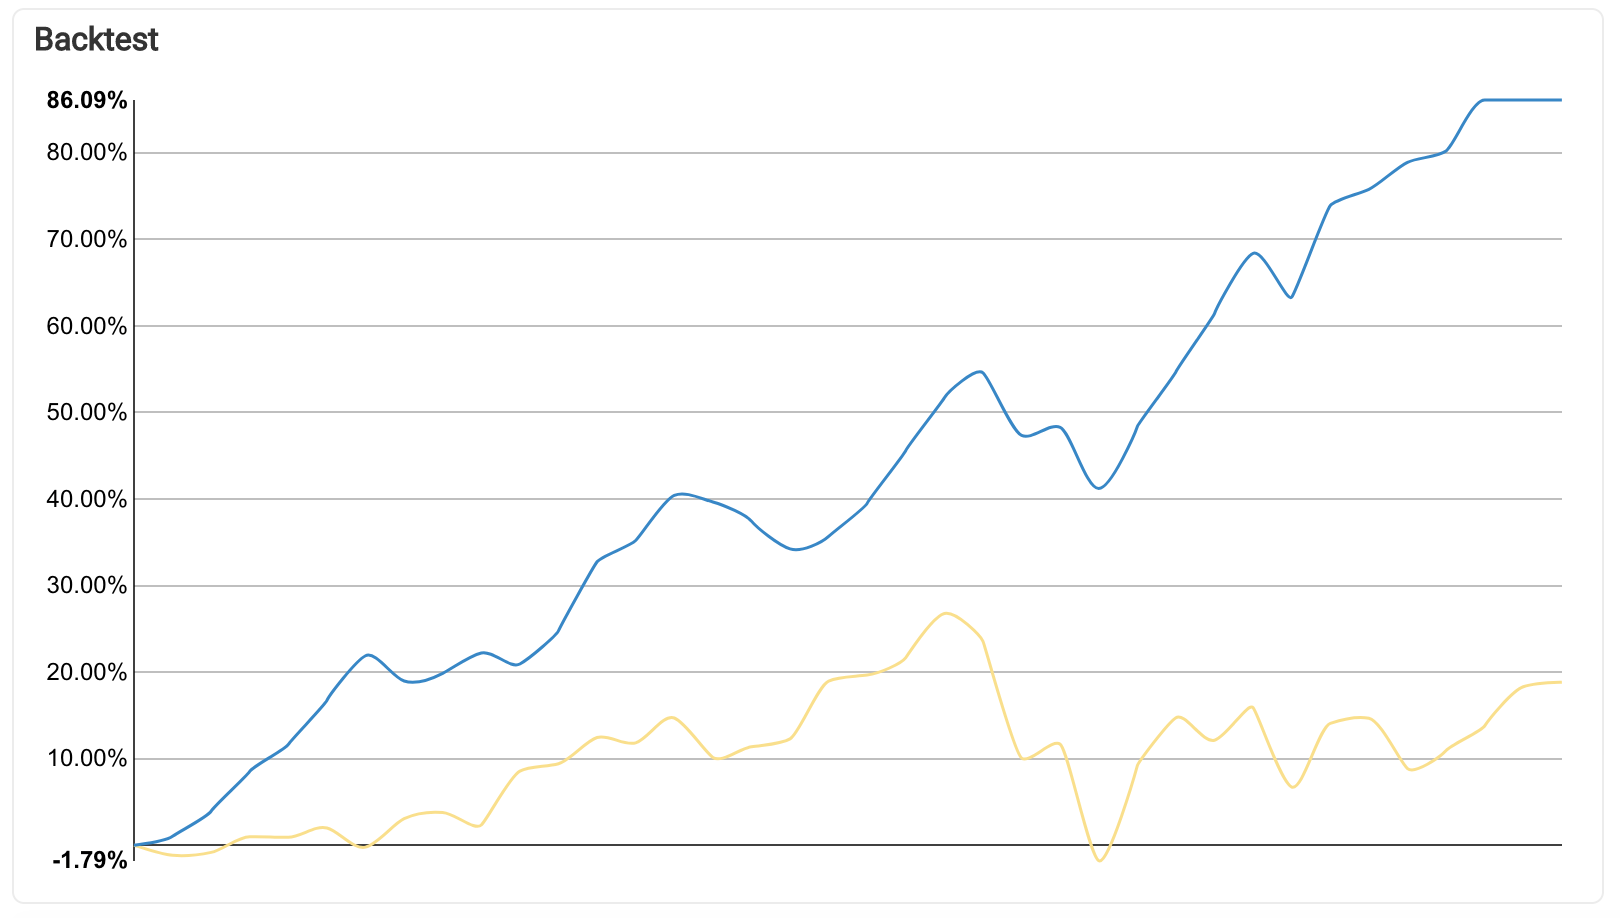
- Total Return for 2010 Venture Capital (blue) vs RUT (yellow) from Dec 2016 to Dec 2019 -
Conclusion
Everysk's private model maps each private real estate, private credit, buyout and venture
capital in our client’s portfolios to a 5 factor fama and french blended index. Our model estimates
private equity factor loadings from cash flows (capital calls/distributions), such that we
minimize the error in net present value (NPV) cross-sectionally. The benefit of our approach is that we use realized cashflows rather than the NAVs which embed appraisal smoothing. Therefore we get less noisy estimates of betas and can measure persistence in fund returns in a way that is not distorted by the smoothing bias.